Introduction
There are a number of factors which can affect the returns on a battery. Oversizing can lead to long returns on investment exceeding 20 years. Whilst under-sizing can result in missed opportunities for further savings. Sizing depends on many factors, should be performed on a case-by-case basis and is nuanced.
The factors affecting the return on investment are discussed. One of the most critical factors is the load consumption profile. Many business consumers may find their consumption profile better matching the solar generation profile than domestic users, and so the question of whether battery storage is needed is raised. The two models used can be seen below in the load timing section below.
- Daytime load profile - two scenarios are considered, morning and evening peaks, vs flat 9am-6pm business usage.
- Battery size - an excessively large battery will cost more and reduce payback time
- Hardware cost per kWh — how expensive the battery is (obviously)
- Tariff choice and night charging — whether cheap off-peak import can be used to shift consumption
- Export rate — what you are paid for surplus solar sent to the grid
What's not considered:
- Battery cycle life and degradation
- Inflation and energy cost increases
- Solar generation peaks and troughs. Unfortunately only hourly weather data is available as opposed to second by second data, so the model does not consider changes in output due to clouds. The data is averaged over each hour, missing some of the benefit of having a battery.
- Hourly load consumption profiles are used which don't consider short spikes in load, for instance due to putting the kettle on. This would again omit some of the benefit in having a battery from the results. The results therefore are lkely to underestimate the benefit in this regard.
Eight modelled runs are compared: domestic morning/evening load versus business-hours (flat) load, each with no battery, a 10 kWh battery, and winter night charging on Economy 7, plus two further business runs with a 5 kWh battery. The domestic profile gains much more from storage. On flat business-hours load, a 10 kWh battery adds only about £67/year at 12p/kWh export; a 5 kWh battery is closer to sized for the site but still adds only about £62/year at 12p export in the modelled runs.
For the business scenario with a flat 9am-6pm load profile, the modelling results show that PV alone meets a large fraction of the load without the need for a battery, as the business load already happens in the solar window, so the solar-only case uses much more PV directly than a domestic morning/evening peak profile. This means the battery only payback is likely to be longer term unless a cost-effective battery is utilised.
These reports were modelled using our solar calculator: open the free Solar Butter solar calculator, which is free to use with no sign up required.
Methods
Study design
Eight historic simulations were run in Solar Butter for one Gloucestershire site across 2025. Table 1 shows the fixed assumptions. Table 2 shows the scenario differences.
| Parameter | Value |
|---|---|
| Site location | Gloucestershire, UK |
| Simulation period | 2025 |
| Annual load | 3,500 kWh |
| Solar array | 3.6 kW (8 x 445 W) |
| Inverter | 5 kW |
| Report tariff | Economy 7: 12p/29p import, 12p export, 60p/day standing charge |
| Export-rates | 12 p/kWh and 7p/kWh scenarios used |
| Scenario | Load profile | Battery | Night charging |
|---|---|---|---|
| Scenario 1 | Morning/evening peak load | None | n/a |
| Scenario 2 | Morning/evening peak load | 10 kWh | No |
| Scenario 3 | Morning/evening peak load | 10 kWh | Winter only |
| Scenario 4 | Business-hours load, 9am-6pm | None | n/a |
| Scenario 5 | Business-hours load, 9am-6pm | 10 kWh | No |
| Scenario 6 | Business-hours load, 9am-6pm | 10 kWh | Winter only |
| Scenario 7 | Business-hours load, 9am-6pm | 5 kWh | No |
| Scenario 8 | Business-hours load, 9am-6pm | 5 kWh | Winter only |
Results
The eight PDF reports below are the source data. The domestic no-battery case exports 2,602 kWh and reaches 39.3% self-consumption. The business no-battery case exports 1,757 kWh and reaches 63.4% self-consumption on the same array and tariff.
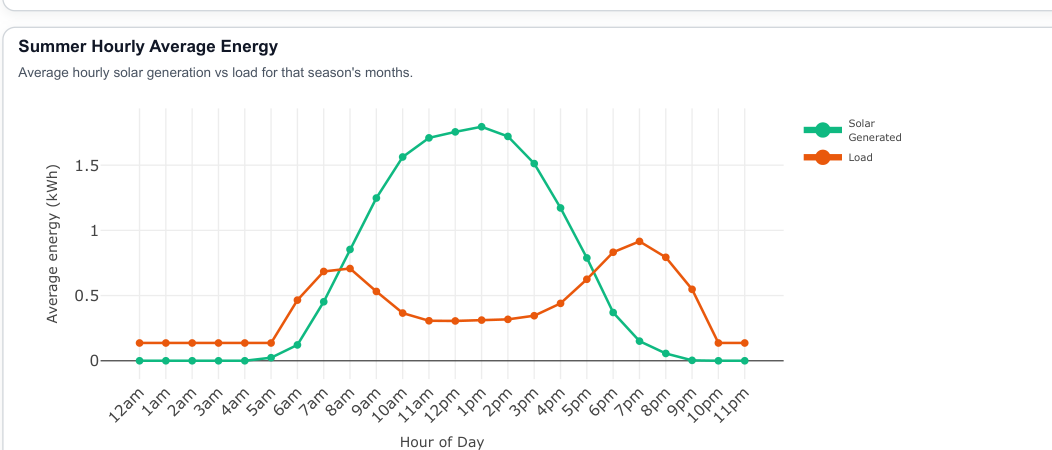
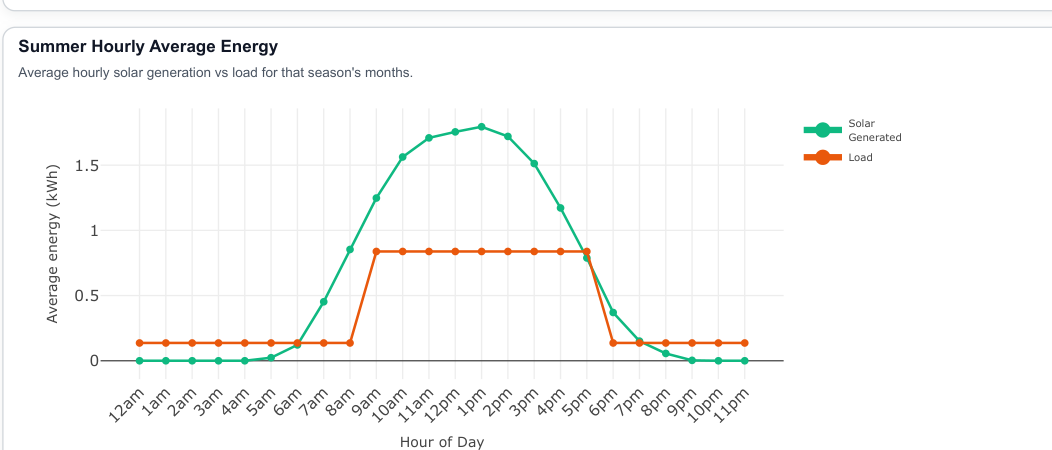
Load timing: domestic versus business
The summer hourly average energy graphs show why the load shape matters. Domestic demand has morning and evening peaks outside the PV peak. Business demand is flatter and overlaps it.
| Scenario | Description | Full PDF report |
|---|---|---|
| 1 | Domestic, no battery Morning/evening peaks export much of the summer surplus. Bill £447/year · 2,125 kWh import · 39.3% self-consumption. | |
| 2 | Domestic, 10 kWh battery Shifts solar into evening peaks. Bill £260/year · 683 kWh import · 80.5% self-consumption. Extra benefit versus Scenario 1: £186/year at 12p export. | |
| 3 | Domestic, 10 kWh battery with winter night charge Imports cheap winter electricity overnight. Bill £173/year · 1,160 kWh import · 66.9% self-consumption. Extra benefit versus Scenario 1: £273/year at 12p export. | |
| 4 | Business, no battery Daytime load already overlaps PV output. Bill £323/year · 1,280 kWh import · 63.4% self-consumption · 1,757 kWh export. | |
| 5 | Business, 10 kWh battery Less surplus solar to store because load already overlaps generation. Bill £255/year · 649 kWh import · 81.5% self-consumption. Extra benefit versus Scenario 4: £67/year at 12p export. | |
| 6 | Business, 10 kWh battery with winter night charge Strongest business battery case, mainly from tariff shifting. Bill £169/year · 906 kWh import · 74.1% self-consumption. Extra benefit versus Scenario 4: £154/year at 12p export. | |
| 7 | Business, 5 kWh battery Smaller battery on flat business-hours load. Report at 7p/kWh export. Bill £317/year · 692 kWh import · 80.2% self-consumption. Extra benefit versus Scenario 4: about £62/year at 12p export, or £93/year at 7p export. | |
| 8 | Business, 5 kWh battery with winter night charge 5 kWh with winter night charging on flat business load. Report at 7p/kWh export. Bill £260/year · 916 kWh import · 73.8% self-consumption. Extra benefit versus Scenario 4: about £131/year at 12p export, or £151/year at 7p export. |
| Profile and setup | Total benefit | Bill | Import | Export | Self-consumption |
|---|---|---|---|---|---|
| Business, 10 kWh battery + winter night charge | £1,006 | £169 | 906 kWh | 1,331 kWh | 74.1% |
| Business, 5 kWh battery + winter night charge | £983 | £192 | 916 kWh | 1,352 kWh | 73.8% |
| Domestic, 10 kWh battery + winter night charge | £981 | £173 | 1,160 kWh | 1,554 kWh | 66.9% |
| Business, 10 kWh battery | £919 | £255 | 649 kWh | 1,099 kWh | 81.5% |
| Business, 5 kWh battery | £914 | £260 | 692 kWh | 1,144 kWh | 80.2% |
| Domestic, 10 kWh battery | £894 | £260 | 683 kWh | 1,099 kWh | 80.5% |
| Business, no battery | £852 | £323 | 1,280 kWh | 1,757 kWh | 63.4% |
| Domestic, no battery | £708 | £447 | 2,125 kWh | 2,602 kWh | 39.3% |
Discussion
The tables below separate the main drivers of battery return on investment: hardware cost per kWh, battery size, load profile, and tariff or export-rate assumptions. Together they explain why the same battery can look attractive for a domestic user but weak for a business that already consumes solar during the working day.
Battery size and hardware cost per kWh
The cost of the hardware is the most important factor! Table 3 shows public hardware listings from about £109/kWh to £280/kWh. Table 5 uses that range assumed hardware costs. At the low end, payback shortens materially; at the high end, payback can stretch to decades!
| Manufacturer | Battery / product | Quoted size | Public price found | Approx. price per kWh | Reference |
|---|---|---|---|---|---|
| Fox ESS | EP12 | 11.52 kWh | £2,457.46 inc VAT | ~£213/kWh | Eco Wizard, accessed 13 June 2026 |
| SolaX | Triple Power TP58 V3 | 5.8 kWh | £1,624 master console as listed | ~£280/kWh | Midsummer Wholesale, accessed 13 June 2026 |
| Fogstar | Energy 48V 32kWh | 32 kWh | £3,499.99 | ~£109/kWh | Fogstar, accessed 13 June 2026 |
These are public hardware listings, not installed quotes.
Load profile: flat daytime use versus morning/evening peaks
Load timing is one of the largest behavioural driver in this model. A domestic profile with morning and evening peaks leaves surplus solar to export or store; without a battery it reaches only 39.3% self-consumption and exports 2,602 kWh. A business-hours profile overlapping 9am-6pm already reaches 63.4% self-consumption and exports 1,757 kWh on the same array.
Tariff choice, night charging, and export rate
All scenarios use Economy 7 with 12p/kWh off-peak import and 29p/kWh peak import. Scenarios 1-6 report at 12p/kWh export; scenarios 7-8 report at 7p/kWh export. Allowing winter night charging changes the battery from a solar-shift device into a tariff-shift device as well: it imports cheap electricity overnight and uses it later, which cuts the bill even when grid import rises.
That helps both load profiles, but not equally. Domestic winter night charging adds £273/year versus no battery; business winter night charging adds £154/year for 10 kWh or £131/year for 5 kWh at 12p export. The business gain is still more about tariff arbitrage than storing daytime solar.
Export rate matters because no-battery cases export more solar. Table 5 reruns the payback sensitivity at 7p/kWh export as well as 12p/kWh. Lower export rates penalise high-export setups and raise the value of storing surplus PV, which is why battery payback improves for both profiles when export falls, even though the business case remains weaker than the domestic one.
| Profile and setup | Assumed battery size | Assumed price per kWh | Assumed hardware cost | Extra benefit at 12p export | Payback at 12p export | Extra benefit at 7p export | Payback at 7p export |
|---|---|---|---|---|---|---|---|
| Domestic | 10 kWh | £109-£280/kWh | £1,090-£2,800 | £186/year | ~5.9-15 years | £261/year | ~4.2-11 years |
| Domestic + winter night charge | 10 kWh | £109-£280/kWh | £1,090-£2,800 | £273/year | ~4.0-10 years | £325/year | ~3.4-9 years |
| Business | 10 kWh | £109-£280/kWh | £1,090-£2,800 | £67/year | ~16.3-42 years | £100/year | ~10.9-28 years |
| Business + winter night charge | 10 kWh | £109-£280/kWh | £1,090-£2,800 | £154/year | ~7.1-18 years | £175/year | ~6.2-16 years |
| Business | 5 kWh | £109-£280/kWh | £545-£1,400 | £62/year | ~8.8-23 years | £93/year | ~5.9-15 years |
| Business + winter night charge | 5 kWh | £109-£280/kWh | £545-£1,400 | £131/year | ~4.2-11 years | £151/year | ~3.6-9 years |
There is a balance between maximising benefit from the solar system and getting a good return. For instance the larger 10kWh gives the most benefit but has the longest return on investment due to the larger initial cost.
For businesses expecting a good return, in this example the 5kWh battery shows a much more attractive range of 3.6-9 years compared to the 6-16 years for the larger battery. This is because of the high capital cost of the larger battery. It's also because the business load profile already matches the solar generation profile quite nicely reducing the need for a battery to some extent. The other consideration is the load and the solar array are not large enough to benefit from a larger battery size.
Limitations
The main limitations are discussed:
- Battery cycle life and degradation. The battery may be only warranted for a certain number of cycles or number of years. This is critical to a payback analysis, but has not been considered in this report. It is recommended to check the individual manufacturer's datasheet for each specific battery.
- Inflation and energy cost increases. Energy prices are likely to increase long term. Which would help to reduce the payback time if considered.
- Solar generation peaks and troughs. Unfortunately only hourly weather data is available as opposed to second by second data, so the model does not consider changes in output due to clouds. The data is averaged over each hour, missing some of the benefit of having a battery. If the effects of clouds were considered making the simulation more realistic, this would help to reduce the payback time..
- Hourly load consumption profiles are used which don't consider short spikes in load, for instance due to putting the kettle on. This would again omit some of the benefit in having a battery from the results. The results therefore are likely to underestimate the benefit in this regard.
Overall the numbers presented in this analysis are likely to underestimate the benefit of having a battery, due to using hourly data. It is left up to the user to check individual battery warranties and cycle life, however.
Conclusion
If your business mainly uses electricity from 9am to 6pm, model the load profile before sizing a battery. Flat daytime use that overlaps solar generation reduces the value of storage because PV is already consumed on site; morning/evening peaks create more work for a battery to do.
Return on investment then depends on the remaining levers: battery size relative to surplus solar and evening demand, hardware cost per kWh, tariff structure, whether controlled night charging is available, and the export rate paid for generation you cannot use. In this model, a 10 kWh battery at £109-£280/kWh adds £67-£154/year for the business profile versus £186-£273/year for the domestic profile; a 5 kWh battery adds £62-£131/year on the same business load with payback ranging from about 3-15 years domestically to 4-23 years for business depending on charging strategy, export rate, battery size, and hardware price.
Solar without storage is the first option to evaluate for a daytime business. A battery is more compelling where load is poorly timed for solar, cheap off-peak import is available, export rates are low, or hardware costs sit at the lower end of the market.
References
- Solar Butter. Historic simulation reports for domestic morning/evening load and business-hours load profiles, 2025 Gloucestershire model.
- Eco Wizard. Fox ESS EP12 11.52kWh 384V Battery with Heating Element. Accessed 13 June 2026.
- Midsummer Wholesale. SolaX Triple Power 5.8kWh Battery - TP58 V3. Accessed 13 June 2026.
- Fogstar. Fogstar Energy 48V 32kWh Battery (Heating + Fire Suppression). Accessed 13 June 2026.
- Ofgem. Smart Export Guarantee guidance and supplier export tariff context. Accessed 13 June 2026.