Summary
Two cases are analysed comparing an EV tariff with a heat pump tariff on a system with a large battery and PV.
The EV tariff comes out cheaper here, with a modelled bill of £408/year versus £828/year on Cosy.
The main reason is a lower average import price obtained during night charging. But this is specific to this case (large battery). Smaller battery sizes would have different outcomes.
These reports were modelled using our solar calculator: open the free Solar Butter solar calculator, which is free to use with no sign up required.
Assumptions
Inputs
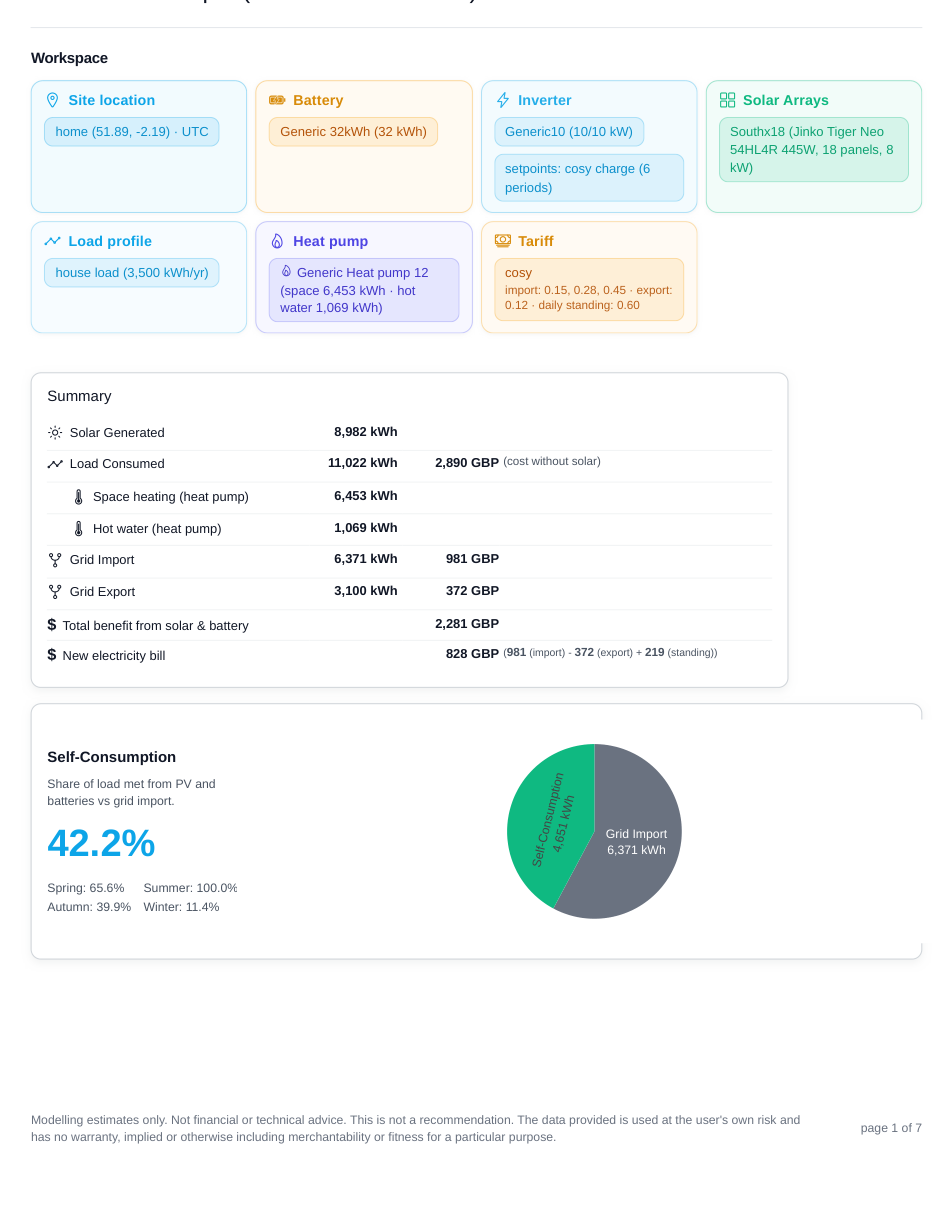
- 163 m2 home with 9.9 kW heat loss at -3 C
- 12 kW heat pump model with 45 C design flow temperature and weather compensation
- 18 x 445 W south-facing panels, about 8.0 kW PV in total
- 10 kW inverter and 32 kWh battery
- 3,500 kWh/year non-heat-pump household load
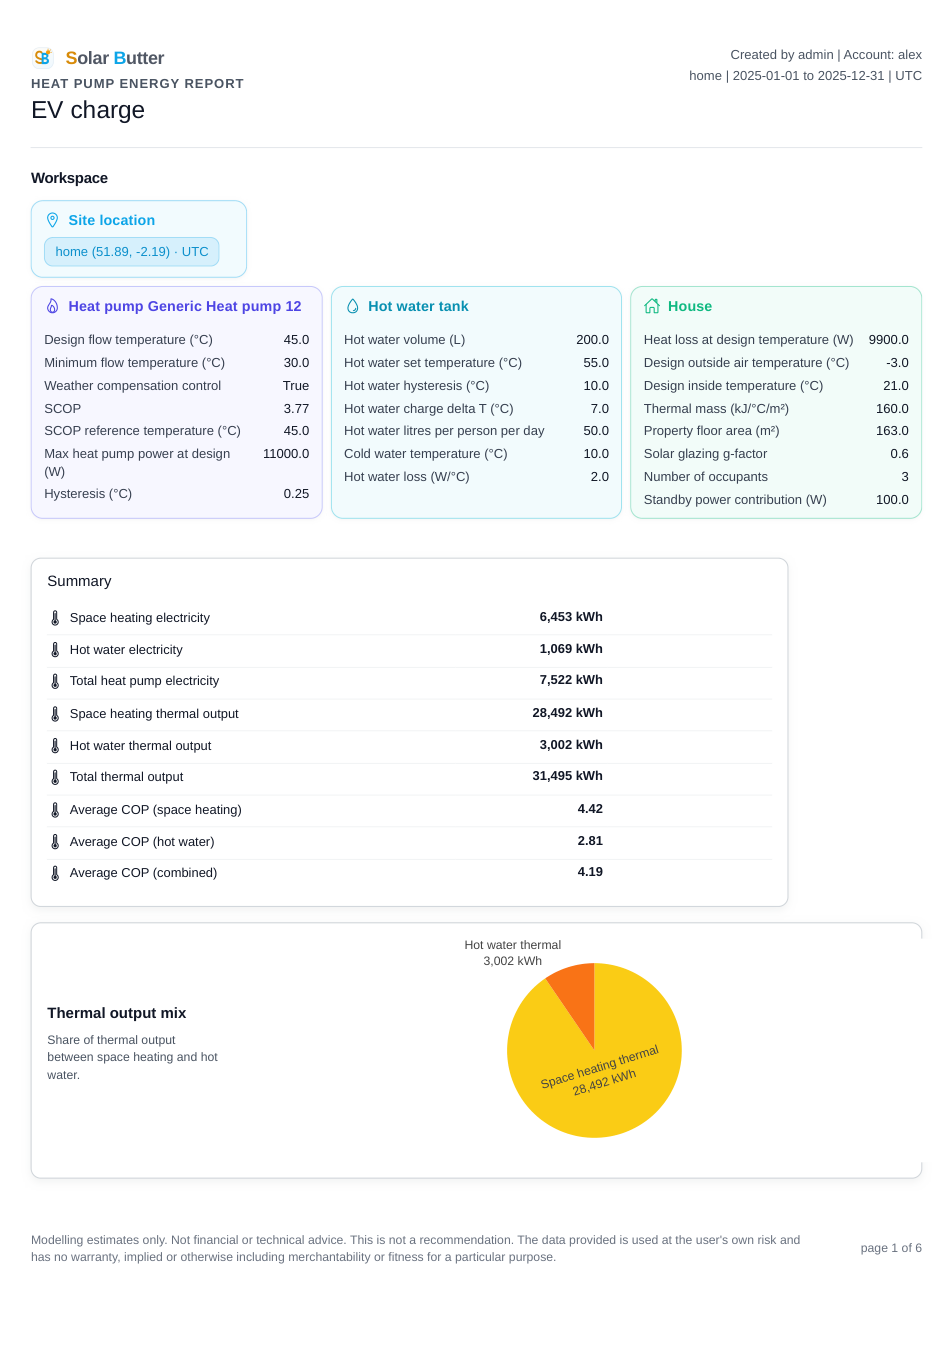
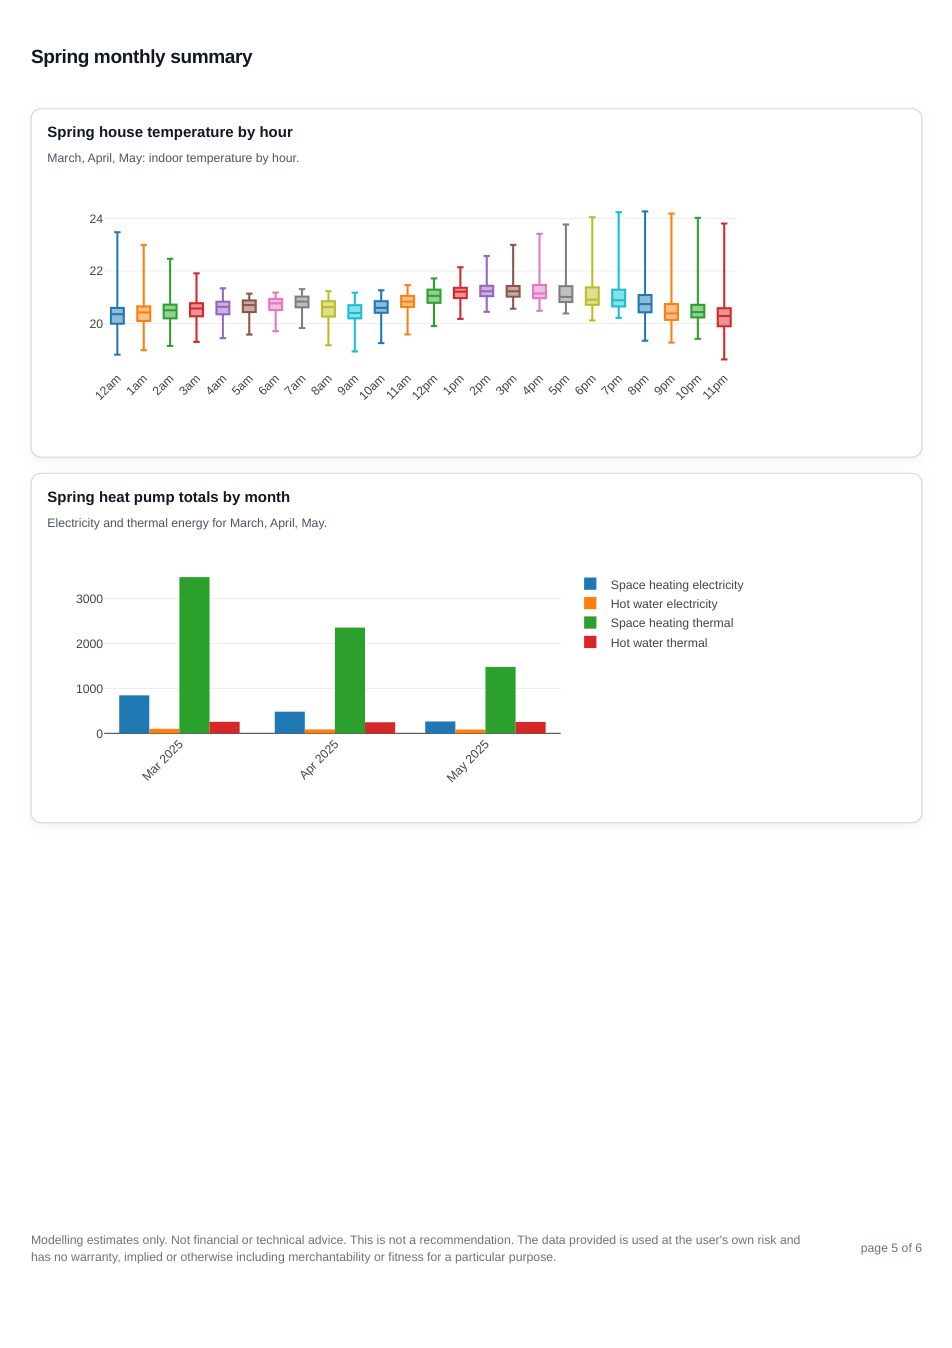
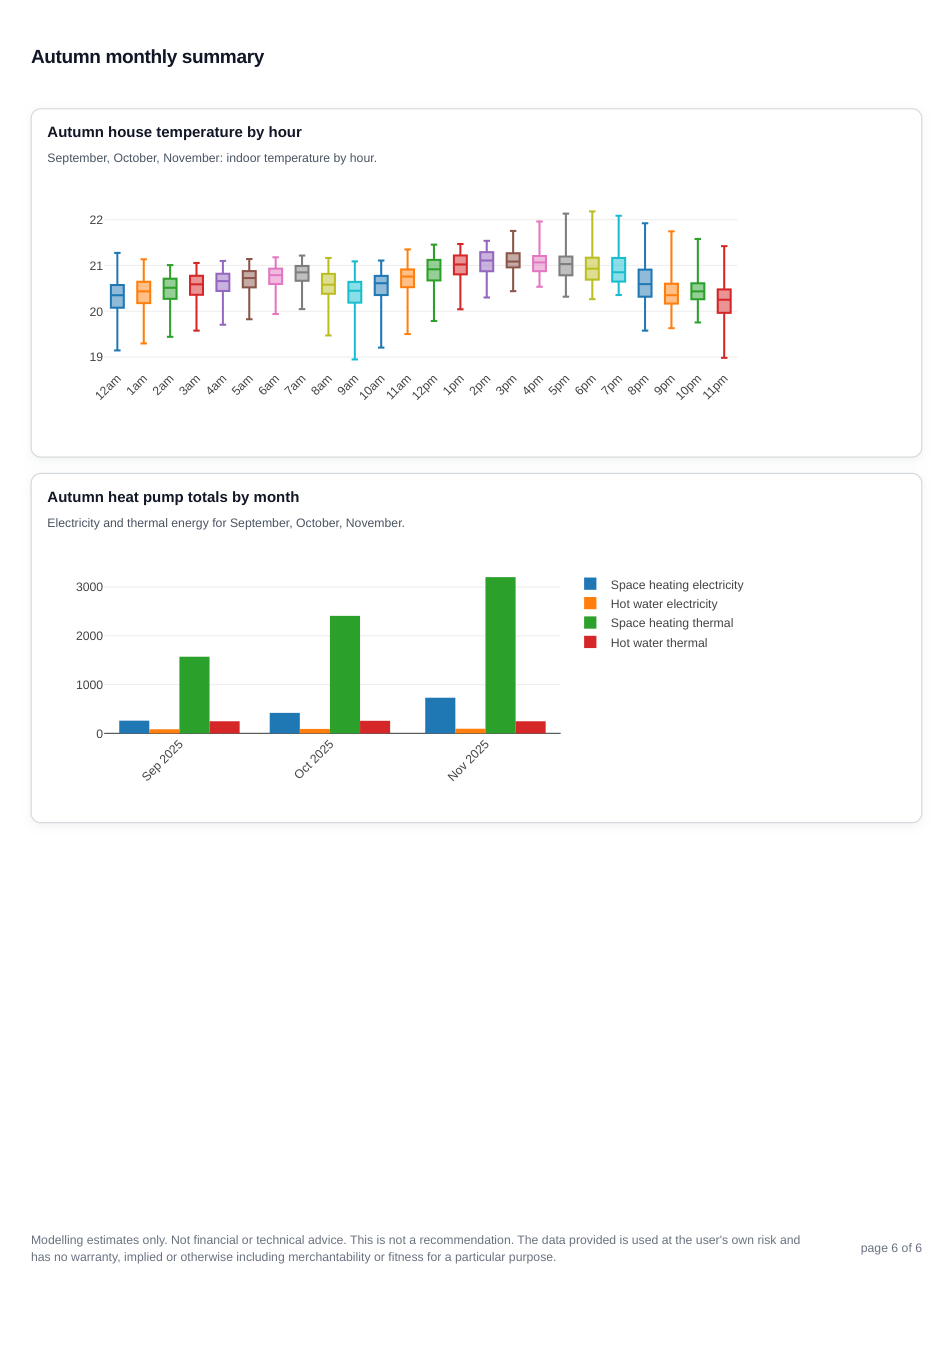
- Heat pump modelled at 6,453 kWh for space heating and 1,069 kWh for hot water
Outputs
- 11,022 kWh total annual electricity load once house load and heat pump are combined
- 31,495 kWh/year total thermal output from the heat pump model
- Average combined COP of 4.19
- The 9.9 kW heat loss points toward a roughly 12 kW heat pump in this model
Scenario 1: Heat Pump Tariff
Inputs
- Same house, heat pump, PV, inverter, and 32 kWh battery assumptions
- Cosy charge setpoints across 6 charging periods
- Import rates of 15p / 28p / 45p per kWh
- Export rate of 12p per kWh
- Standing charge of 60p/day

Outputs
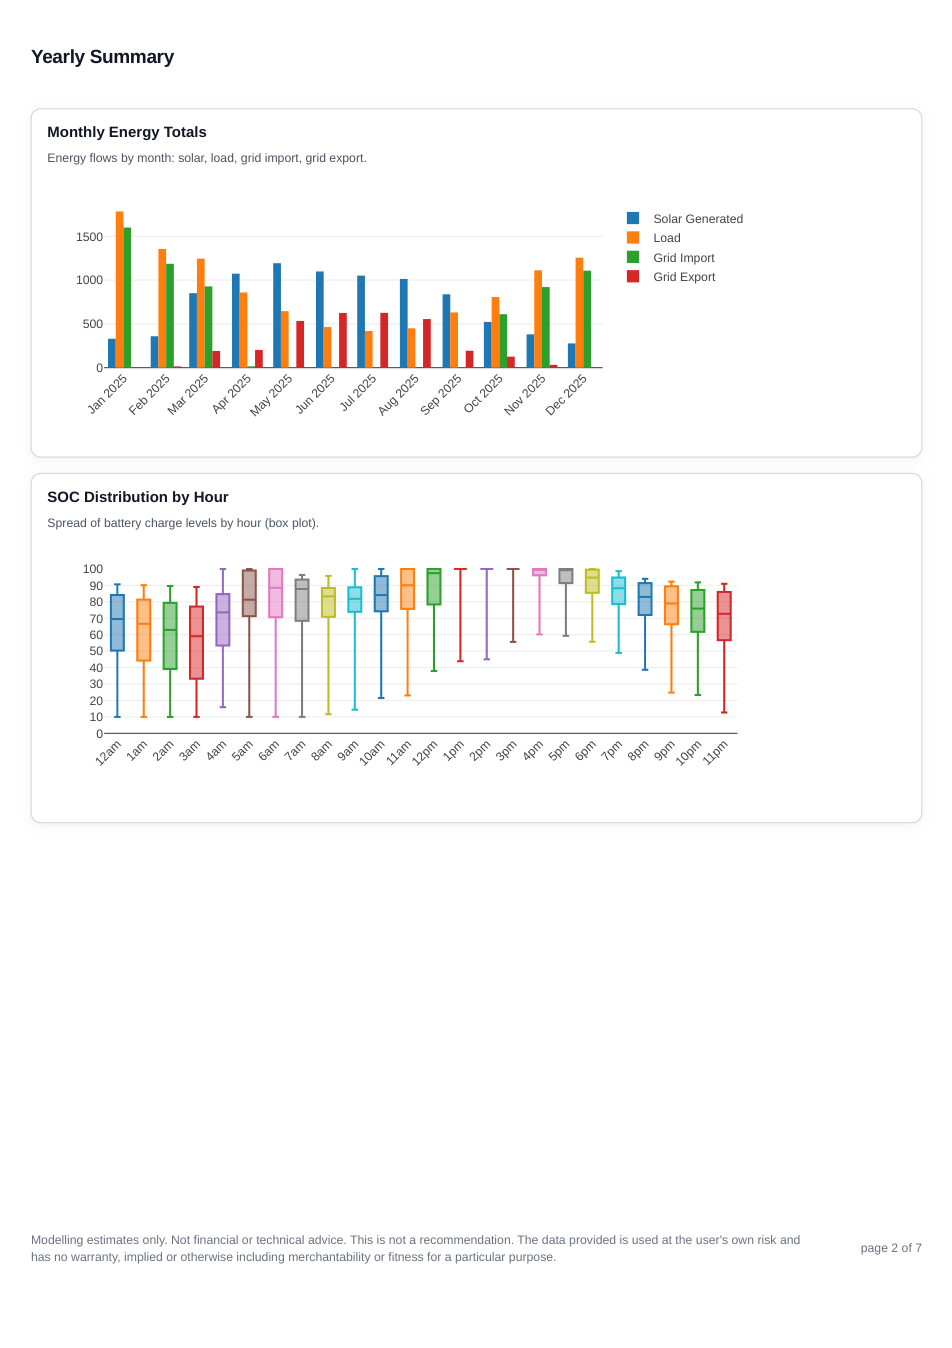
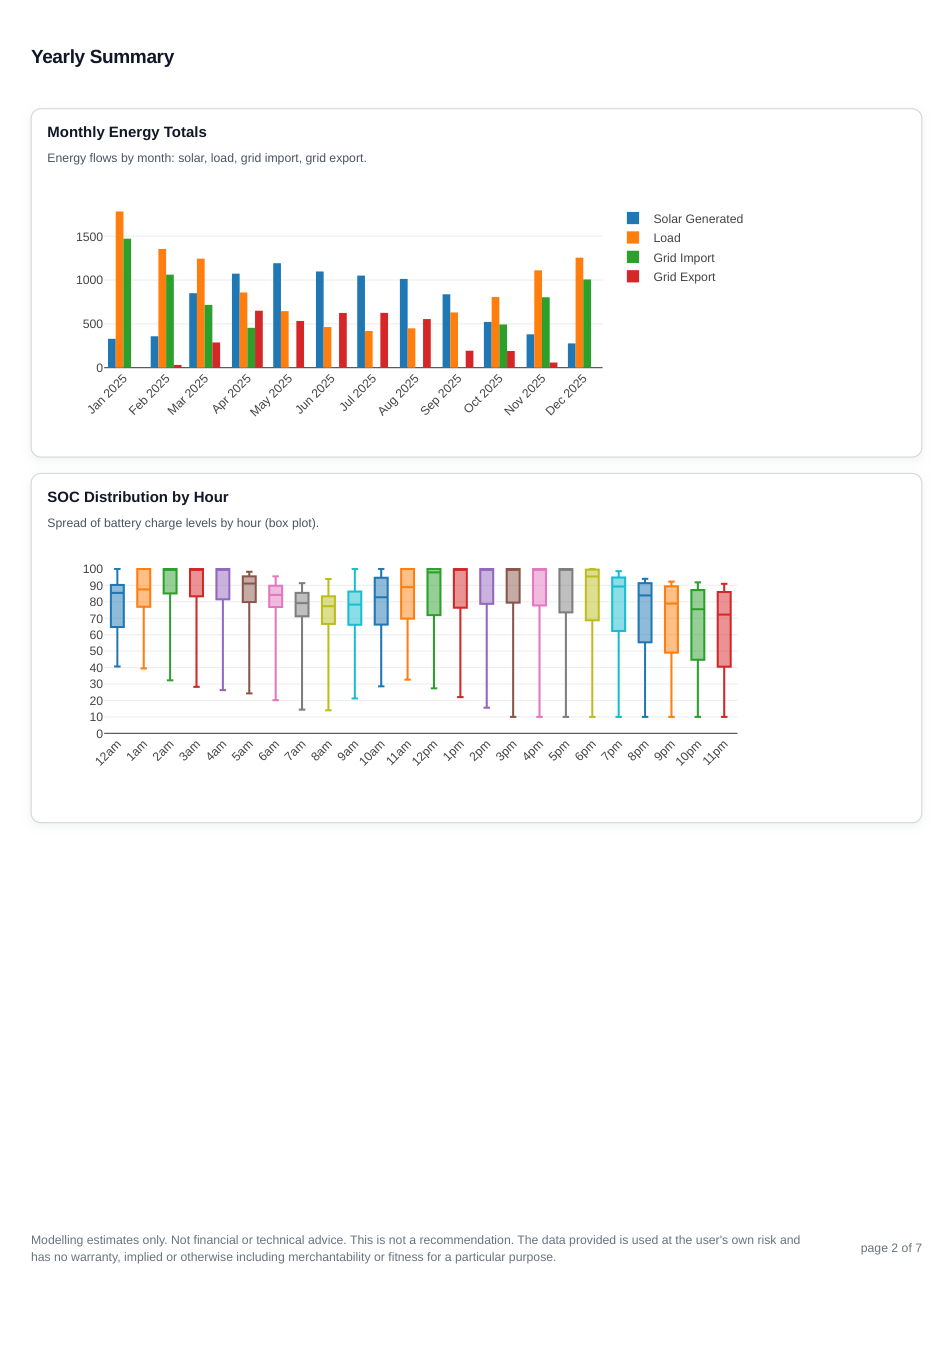
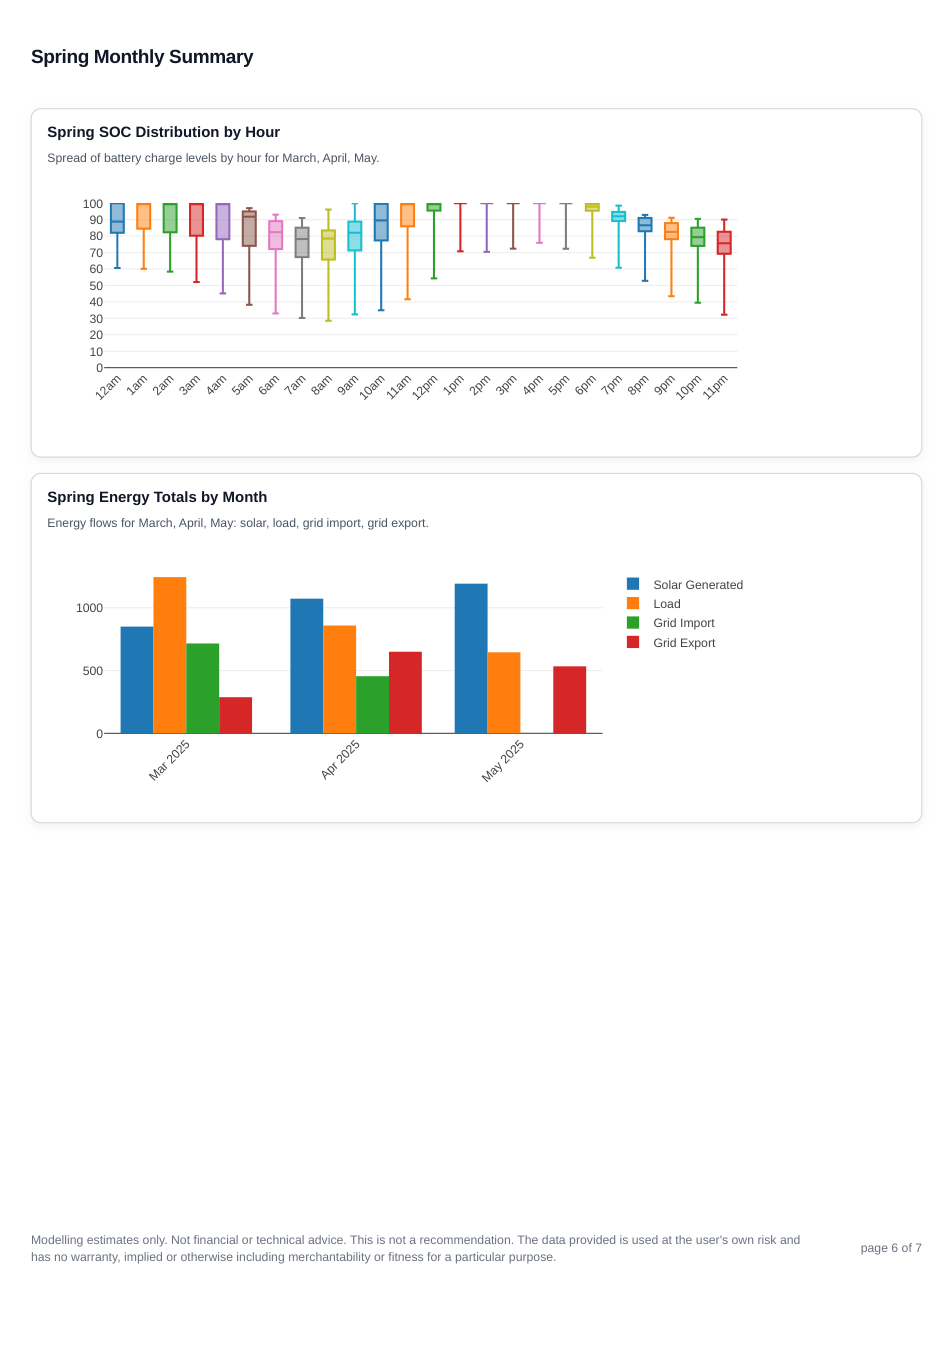
- 8,982 kWh annual solar generation
- 6,371 kWh grid import costing £981/year
- Average imported energy price of 15.4p/kWh
- 3,100 kWh grid export earning £372/year
- 42.2% of annual load met by PV and battery
- The second Cosy charge period lands around midday, so some battery headroom can be taken by grid charging just as solar is available
- Modelled bill of £828/year including standing charge
- £2,281/year total benefit from the PV and battery system
Scenario 2: EV Tariff
Inputs
- Keep the same house, heat pump, PV, inverter, and 32 kWh battery
- EV charge setpoints across 5 charging periods
- Import rates of 9p / 30p per kWh
- Export rate of 12p per kWh
- Standing charge of 60p/day
Outputs
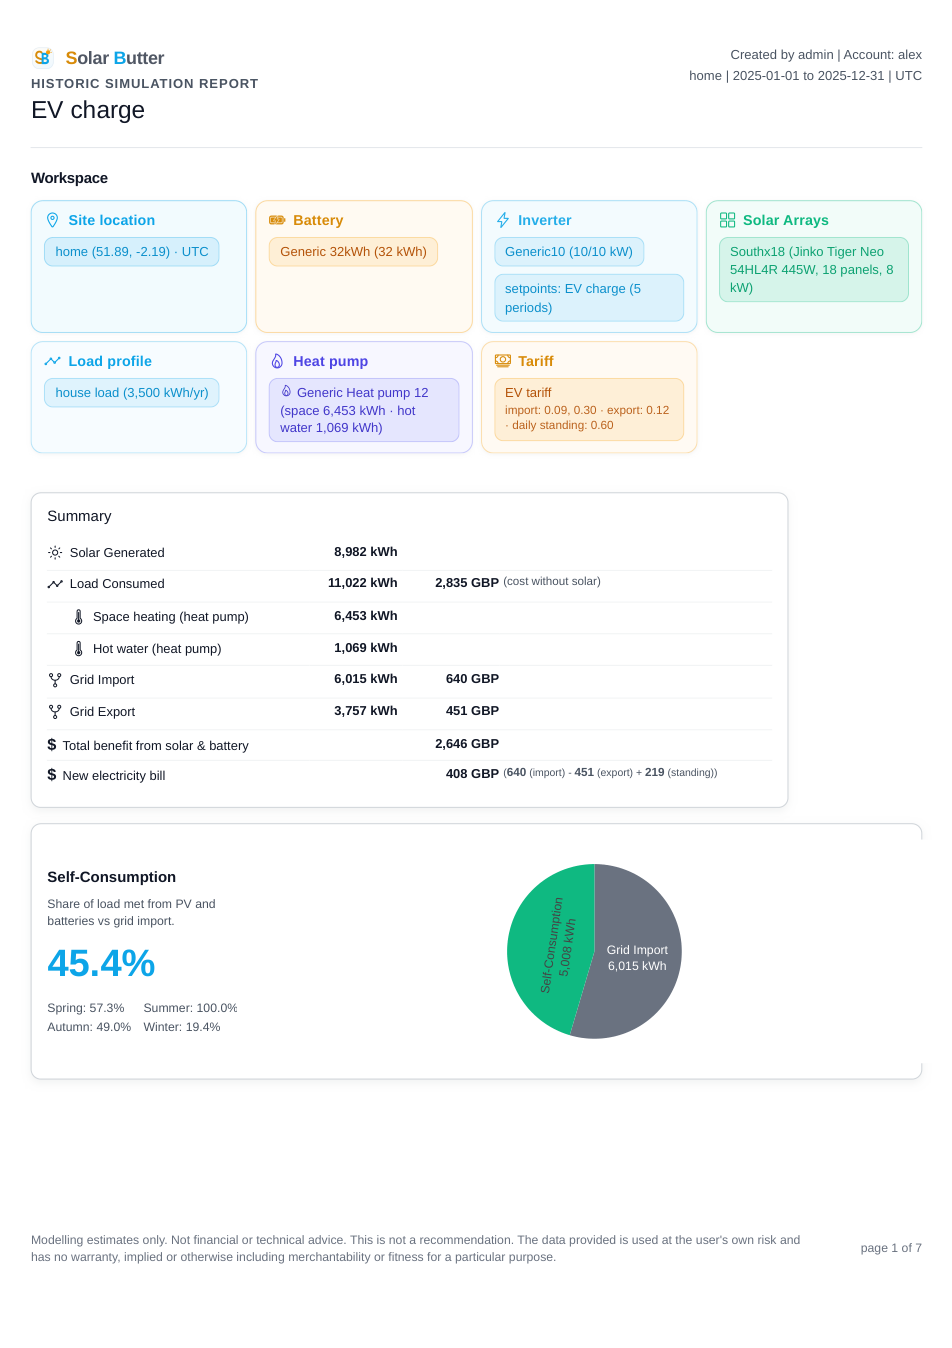
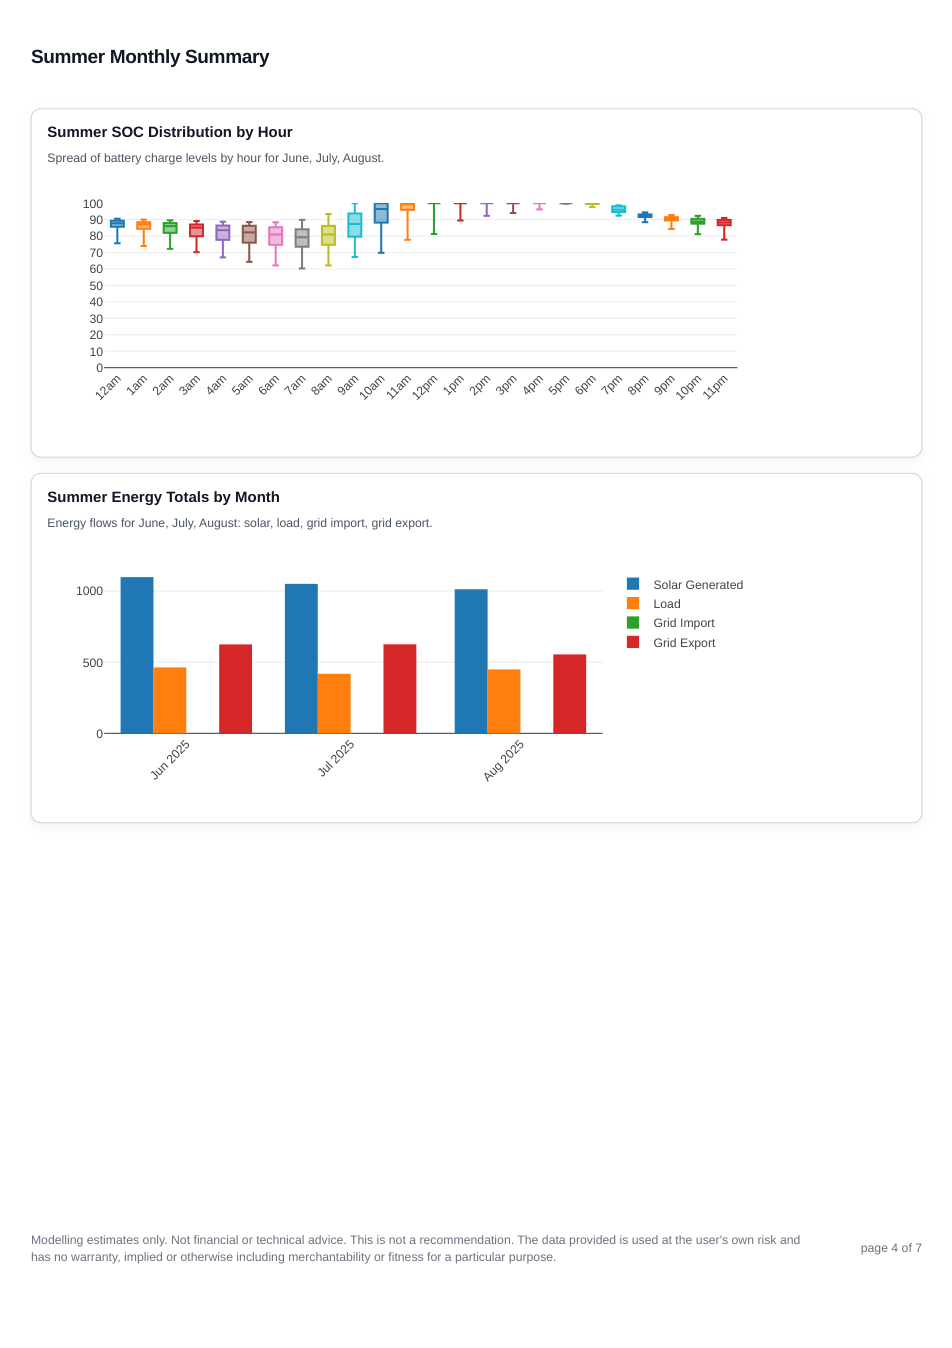
- 8,982 kWh annual solar generation
- 6,015 kWh grid import costing £640/year
- Average imported energy price of 10.6p/kWh
- 3,757 kWh grid export earning £451/year
- 45.4% of annual load met by PV and battery
- Modelled bill of £408/year including standing charge
- £2,646/year total benefit from the PV and battery system
Comparison
15.4p/kWh average import price
6,371 kWh imported and a modelled annual bill of £828.
10.6p/kWh average import price
6,015 kWh imported and a modelled annual bill of £408.
4.8p/kWh cheaper imports
The EV tariff is ahead by about £420/year, with about £365/year more total benefit.
The main comparison point here is the average imported energy price. The average imported unit price falls from 15.4p/kWh to 10.6p/kWh.
There is also a control-timing effect. The second Cosy charge window lands in the middle of the day, so the battery can be partly filled from grid import just as the sun is shining. That reduces headroom for solar charging and can push midday PV straight to export instead of holding it back for later use in the home.
That is why the EV tariff wins on both cost and import volume. In this setup, the large battery is more valuable when it can avoid that midday clash and when the imported energy it does buy is much cheaper on average.
Put simply: the EV tariff model benefits from both a lower average import price and a charge schedule that interferes less with midday solar.
| Scenario | Off-peak import price | Grid import | Import cost | Average import price | New bill | Total benefit |
|---|---|---|---|---|---|---|
| Heat pump tariff | 15p/kWh | 6,371 kWh | £981 | 15.4p/kWh | £828/year | £2,281/year |
| EV tariff | 9p/kWh | 6,015 kWh | £640 | 10.6p/kWh | £408/year | £2,646/year |
The table shows why average import price is still the main metric, but the daytime Cosy charge window is an important part of the story because it can turn good solar hours into export hours.
Conclusion
For this exact 163 m2 home, the 9.9 kW heat loss is consistent with the 12 kW heat pump used in the model.
Cost wise, the EV tariff is the better fit. The headline reason is the lower average imported energy price, and the second reason is that the import is slightly less. This could be considered a surprising result, but it can be explained, as the EV tariff avoids midday charging. The midday charge point means that the battery could become full during midday, when the sun is shining. Effectively replacing free solar energy with imported energy. This means that with the heat pump tariff the import is higher but also the export is higher. Because the off-peak import and the export prices are similar however, this is not so terrible.
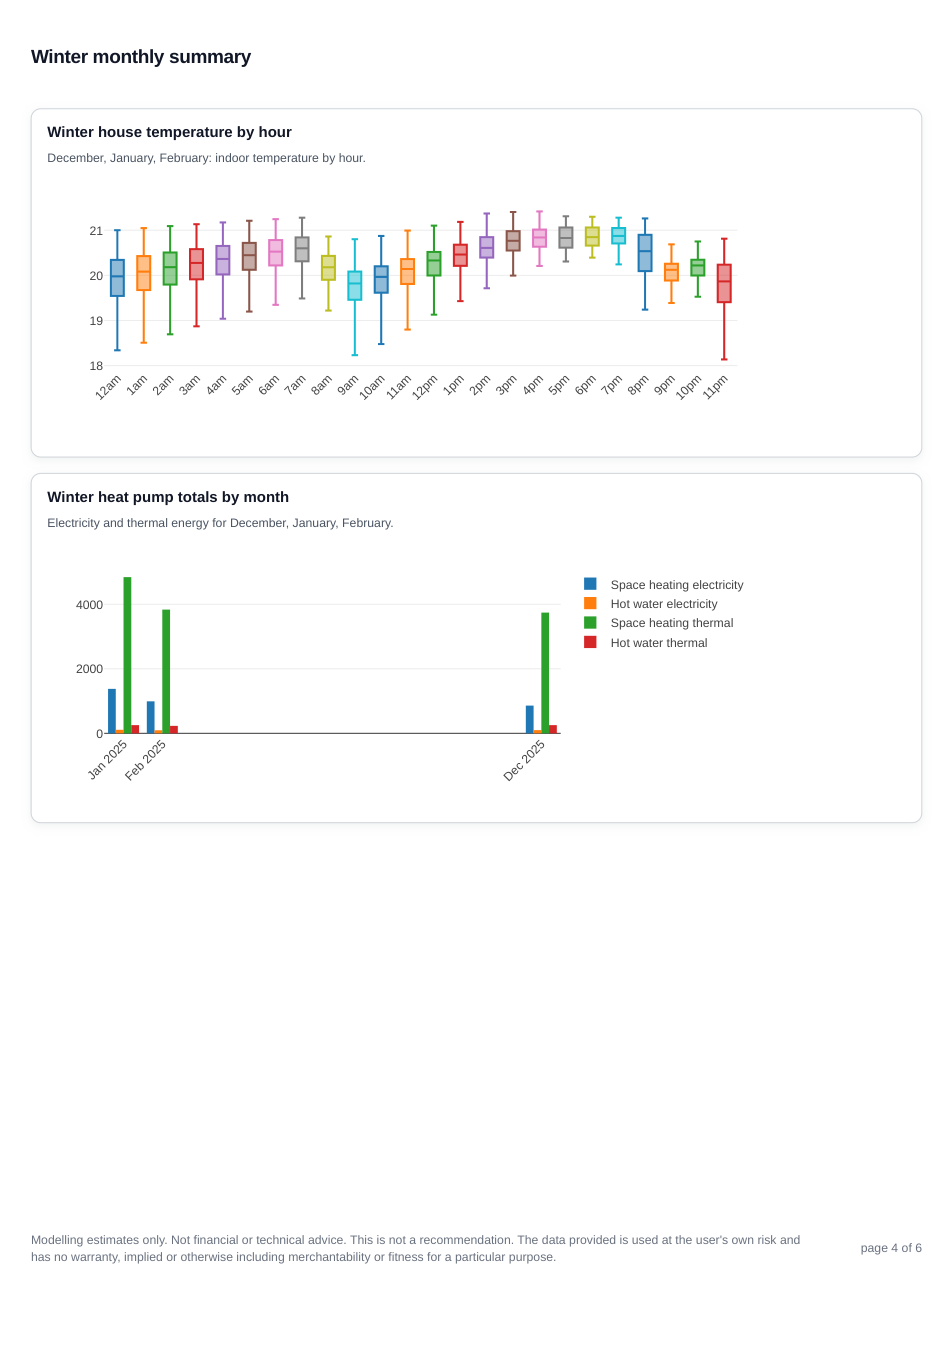
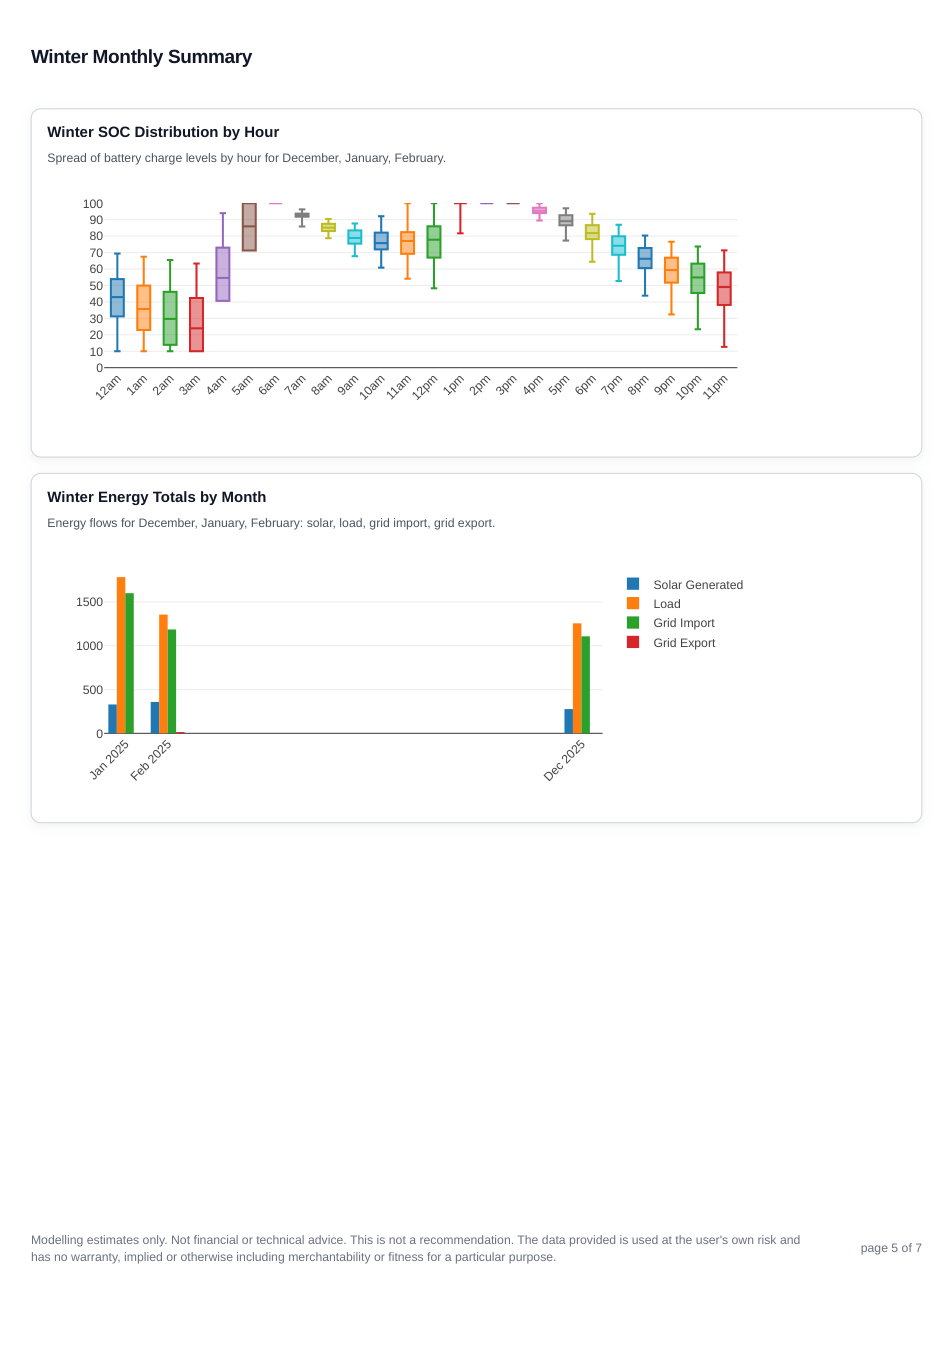
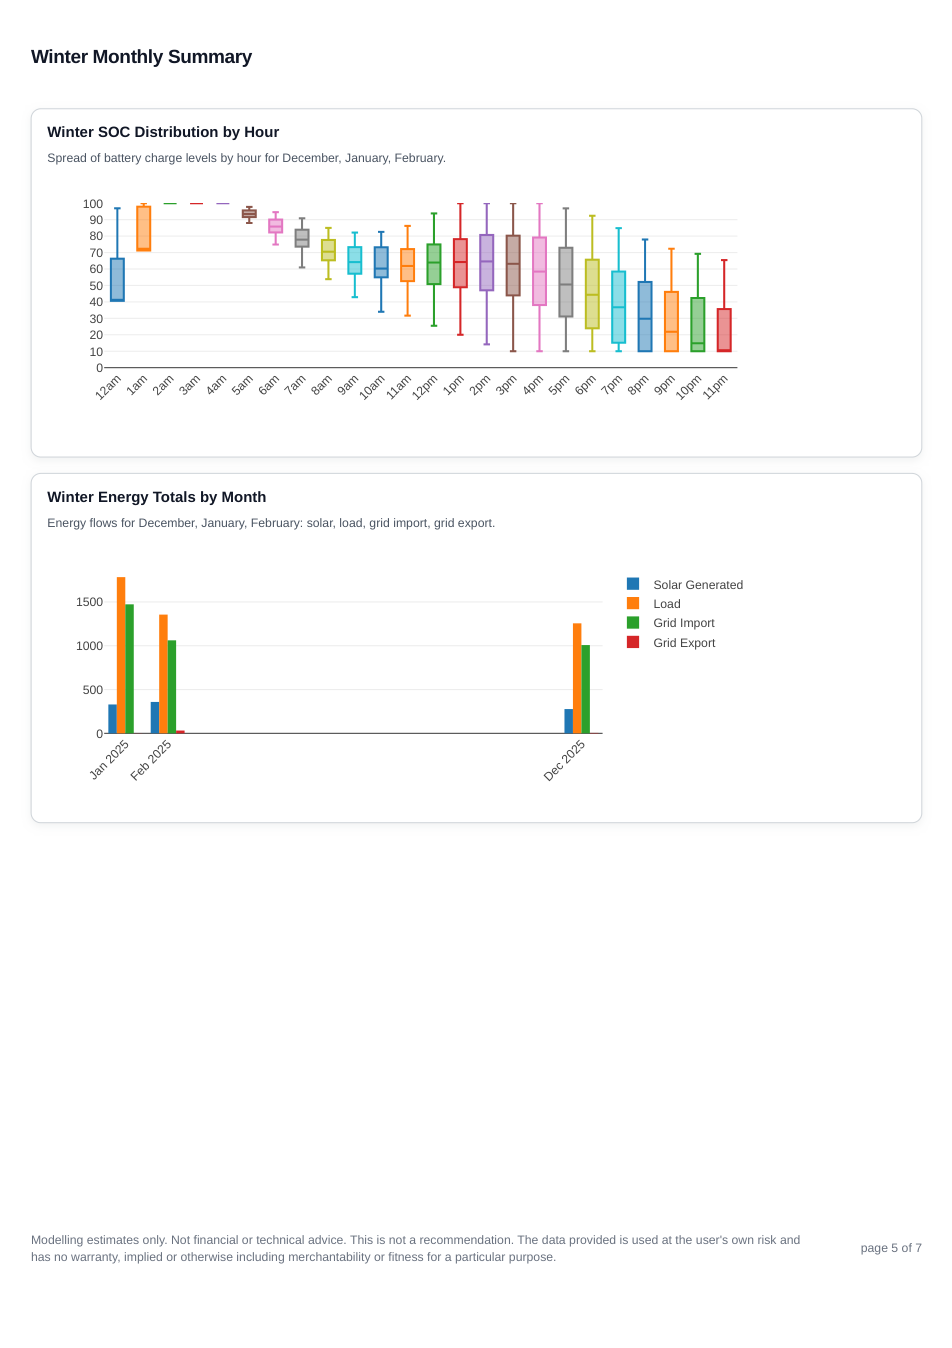
The downside of the EV tariff isn't really a problem here because the battery is quite large, however it should be noted anyway. It can be seen that the battery loses its charge earlier in Winter, because there is only one charge time. So by around 10/11 pm in winter the SOC is often empty. This means that a higher rate for energy. This would be a serious consideration if the battery size was smaller. But in this case it only pushes up the average electricity price by 1.6 p/kWh.
If the goal is the lowest running cost for this setup, the EV tariff model comes out ahead.